Sunday, May 15, 2022

Latest writings are now on substack


All my writing is now being posted on my new substack page.

Please subscribe there to get new posts to your email.

Here's a preview of some of the latest articles.

The content of this site will ultimately be merged with the content on substack when I launch a better Fresh Economic Thinking experience in 2023.

Sunday, April 24, 2022

A social housing fund is bad policy


A social housing fund is a policy idea gaining traction. The ALP has proposed a $10 billion one in their election platform. The Grattan Institute has proposed a $20 billion one.

The basic idea is to sell bonds to the market and use the cash from that sale to buy a range of higher-yielding assets. Because there will be a differential return between the low cost of borrowing and the higher return on assets, this creates a net return from the fund to pay for building new public housing.

It sounds so bland and innocuous that it is easy to miss how economically backwards the policy really is.

...

Read the rest of this post at my new substack page and please subscribe there to get new posts to your email.

Sunday, April 10, 2022

Housing stock per capita mostly measures demographics

I don’t like this chart. 


Not only is there an unjustified implication of direct causality (X causes Y, and planning regulations cause X), the pattern in the chart rests on choices about
  1. countries,
  2. time periods,
  3. measures of the housing stock, and 
  4. measures of the price of housing.
I want to focus here on how comparing countries with different demographic trends, particularly ageing, has implications for interpreting housing stock per person measures.

...

Read the rest of this post at my new substack page and please subscribe there to get new posts to your email.

Wednesday, March 16, 2022

Why politicians must pretend to want cheap housing


UQPPES Statecraft Autumn Lecture, March 2022

Let me start with my thesis.

Much of the contemporary debate about housing affordability is a distraction; promoted by vested interests and reinforced by political incentives. The proposed solutions are usually policies that favour property owners, not renters and buyers.

The first way we know something is off is the language. Affordability is a beautifully vague word. It’s a word that works nicely as a covert signal—that is, a word that means something different to your target audience compared to others.

Aspiring homeowners can be led to believe that the word implies cheaper prices to buy homes. Maybe also cheaper rents. They feel their concerns are acknowledged. It appears like something is being done for them.

For homelessness and public housing advocates, the word affordability can imply a boost to public housing investment to provide non-market housing options to the neediest. The word makes it appear that something is being done for them too.

But the beauty of a covert signal is that the true meaning is known only to the target audience. In this case, large property owners and developers. They know that affordability means that absolutely nothing will be done that puts the value of their property assets at risk. To them, the word is an invitation to participate in the next great property scam.

They know that to appear to be doing something about affordability, their political mates will simply ask them what policies they want. Whatever tax break, rezoning, or subsidy they come up with will then become the nation’s new “affordable housing” policy.

It is no leap to say that these outcomes are in fact the real objective of pretending to care about cheap housing by distracting us with the word affordability.

In his 1946 essay on Politics and the English Language, George Orwell wrote:

When there is a gap between one's real and one's declared aims, one turns as it were instinctively to long words and exhausted idioms, like a cuttlefish spurting out ink.

Affordability is a long word that hides the real aim of boosting the asset portfolios of major property owners behind the declared aim of making housing cheaper for residents.

So why must politicians play this Orwellian game of pretend at all? There are three political economy issues at play.

...

Read the rest of this post at my new substack page and please subscribe there to get new posts to your email.

Sunday, March 13, 2022

Falinski's housing inquiry report will be peppered with lobbyist catch phrases...

...and many journalists will lap it up uncritically.

Like the dozens of previous housing inquiries before it, Falinski’s inquiry into housing supply will find that giving valuable rezoning development rights to well-connected property owners and developers is the housing policy we need.

The puzzling part is that the housing developers interviewed under oath during the inquiry said that they wouldn’t flood the market to decrease prices even if they could.

Falinksi: Is it not your view that, if we increase the amount of supply, prices will go down?

Mr Helmers: I don't think that's the case…

Mr Long: My view is consistent with Richard's: rezonings won't necessarily lead to lower housing prices…
…
Falinksi: …[d]o you think if state local governments rezoned more land to allow greater supply, that you could see dwelling prices drop by 20 per cent?

Mr Warner: No. Straight out, I concur with some of the comments before. It's not going to create that much of a difference.

For perspective, Australian capital city housing prices increased 21.7% in the year to September 2021. No housing developer thought it plausible that mass upzoning could get close to reversing one year’s price growth.

Instead, they all latched on to the phrase that mass rezoning will “will moderate price growth”. I have no idea what this means. If price growth is zero in the counterfactual, will it mean prices start falling? If it moderates price growth, why can’t rezoning moderate price growth down to a negative?

...

Read the rest of this post at my new substack page and please subscribe there to get new posts to your email.

Sunday, March 6, 2022

My COVID story - Part 2

Read My COVID Story - Part 1 here.

January 2021 - Sticking with the crowd

I was approached to write a short piece for The Mint magazine. I sent a rough draft of the type of article I would write. When it dawned on them that I was going to challenge the COVID mantra they decided that they must stick with the crowd and not publish anything.

I later put that draft piece on my blog. The predictions in it have been quite accurate. Take a look.

Back then, zero COVID was still a thing that people thought was possible, despite all evidence. The vaccines were going to be the way to achieve that dream. 

June 2021 — Vaccinate the kids becomes a thing people want to do

I was invited on ABC’s Q+A television program to be a panelist sharing opinions about COVID policy. You might be wondering how someone gets invited. My experience was that Stan Grant and the producers wanted to be able to say that our reaction to COVID was overblown but didn’t want to have to say it themselves and cop the flak.

Here’s a write-up about that appearance from ABC News.
...

Read the rest of this post at my new substack page and please subscribe there to get new posts to your email.

Monday, February 28, 2022

If planning constrains housing supply, how does it do it?

I’ve long puzzled over the exact mechanism by which planning regulations are supposed to constrain the rate of new housing supply. Sure, they constrain the locations at which different types and densities of uses can occur. That’s their purpose.

But density (dwellings per land area) and the rate of supply (new dwellings per period across all sites in a region) are very different.

It seems logical to me that landowners maximise their economic returns from two choosing

  1. a density of development that maximises the residual (i.e. their revenue minus the cost of development), and
  2. a rate of sales (and hence development) per period of time.

It is not at all clear that if more dwellings can be built on one site that this changes the optimal rate of sales per period for that site.

It is also the case that only landowners can choose to make planning applications, and that a huge majority of approvals are for projects that exceed coded density limits. We have a property market after all.

What I am puzzled about is that when someone claims that planning reduces housing supply, what sort of counterfactual pattern of supply do they have in mind?

...

Read the rest of this post at my new substack page and please subscribe there to get new posts to your email.

Monday, February 21, 2022

My COVID story - Part 1

March 2020 — People lose their minds

My first ever public comment about COVID was this. I was both prescient and wrong.

Everyone has lost their shit about coronavirus as if lives lost this way are worth orders of magnitude more than lives lost any other way. In two to three weeks time the reality will set in that there are real costs of locking down society that can be measured both in value of resources wasted and in blood. All perspective has been lost at present.

If only I’d written years instead of weeks, then it would have been spot on.

As someone who has thought about health policy, well-being, and trade-offs for many years, my first reaction to the media coverage of COVID and the mystery China virus was to ask the following question: What is the normal number of deaths in a city the size of Wuhan? Without this context, all the media coverage made no sense. A city with 12 million people can expect about 96,000 deaths a year. That’s 264 a day.

So when I read headlines like “Death toll rises to 600” and that smoke from crematoriums working overtime was filling the city, I had a reasonable baseline from which to sniff out nonsense. The numbers mattered then and they still matter now.

If you search online for news articles of COVID or coronavirus deaths from February 2020 you will see just how small the death numbers are and how crazed and fearful the reporting was. Some of the reporting just had made-up figures, with orders of magnitude differences from one article to the next. No one really cared.

Even at this early stage, the lack of deadliness of the virus was becoming clear for those who wanted to find out. The case fatality rate was likely to be sub 0.7%, even with relatively limited testing (i.e. 0.7% of known cases, not all cases). Clearly, this implied that early estimates were hugely biased because infections were far more widespread than initially assumed.   

The Diamond Princess cruise ship had 3,711 people on board and had 14 deaths.  On this cruise, 0.37% of people died over a two month period. Is that good or bad?

We know that background mortality is about 0.8%. So every two months you can expect 0.13% of people to die. But this is across the whole age distribution. Even a small skew towards the elderly massively increases this number. For example, in your 80s you have a one in twenty chance of dying each year on average. In your 90s, a one in five chance.

The age distribution of the Diamond Princess was super high, so 0.37% of people dying within two months is totally within the normal range.

We knew this in March 2020.


Image source: https://wattsupwiththat.com/2020/03/16/diamond-princess-mysteries/

We already knew then from the Italian outbreak that the average age of COVID deaths was higher than deaths from all other causes combined.

Taking all this information together was pretty encouraging. This is why herd immunity was thought to be simply a matter of months away. Flatten the curve for two weeks, then a month or two later the whole thing would be over. No one expected to be having masks, border closures, vaccine mandates and passports for two years.

With markets crashing I took the opportunity to put forward some ideas about macro-stabilisation policy, such as having a public agency take equity stakes in companies that wanted bail-out money and buying up housing developments in distress to smooth construction cycles and add to public housing stocks.

Of course, none were taken up. But looking back, they were much more sensible than what we got with a JobKeeper giveaway, a Cashflow Boost, that cost hundreds of millions and resulted in a net upwards redistribution of wealth.

Read the rest of this post at my new substack page and please subscribe there to get new posts to your email.

Wednesday, February 2, 2022

New metrics to show the value of delaying housing supply

*This article is based on a submission to the Housing Supply Inquiry that I contributed to for Prosper Australia.

This neglected economic puzzle has become a heated policy debate. Rapidly rising dwelling prices globally have grabbed the attention of policy makers. Many have subsequently targeted planning and zoning as areas for housing reform. Australia, New Zealand, the United Kingdom and various states in the United States, are conducting new reviews into planning, housing supply, and prices.

Unfortunately, most analysis of housing supply conflates density (dwellings per unit of land) and the rate of new housing supply (new dwellings per period of time across all sites). This is because the time dimension of the investment decision facing a landowner is typically ignored in the economic analysis of housing supply.

But the optimal inter-temporal choice of landowners is hugely important for understanding the rate of new housing investment in property markets. Just as there is an optimal density of development that maximises the value of the site, there is also an optimal rate of sales of new dwellings per period that maximises the value of the site.

Across all candidate development sites in a region, the rate of new housing development (new dwellings per period of time) is known as the market absorption rate or build-out rate. Regardless of planning or zoning, this rate is the result of many landowners making individually-optimal choices about when and how fast to develop. 

The economic logic behind the market absorption rate is described in Murray (2021). Some key elements of it are important to clarify. Owners of the property where a new home can be built already possess an asset on their balance sheet worth exactly the market value of the land. Developing that land with a new dwelling is a balance sheet reallocation. If developed for immediate sale, the property owner is swapping an undeveloped site asset for a cash asset. If developed for rental, the owner has swapped an undeveloped land and cash asset (to fund construction) for a dwelling asset. 

Whether these asset swaps are economically viable depends on the relative returns to each. Only in a market where demand is rising does it make sense to increase the rate at which undeveloped land assets are swapped for cash assets. When market demand is falling and very “thin” (few buyers at current prices), it makes sense to slow the rate of new housing development. Other factors like interest rates (the return on cash after sale), taxes on land ownership (that reduce the return to retaining ownership of undeveloped land), and the ability to vary the density of development in the future (a flexible planning system can make delay more profitable by allowing higher density in the future, increase the return to delay), all have effects on this rate. 

One interesting problem for this new type of analysis is demonstrating how economically important the payoff to delaying new housing development is for property owners. To address this, I am proposing here some new metrics that can be applied to housing developments to demonstrate the degree to which varying the rate of sales in response to market conditions increases the total economic returns from developing a site. These metrics demonstrate that independent of any planning controls on density, there is a “speed limit” on the supply of new housing in the form of the market absorption rate.

Development Rate Ratio (DRR)

How fast did the subdivision develop compared to how fast it could have if the maximum observed rate of sales was sustained?

Housing developers often argue that new housing is being built as fast as the planning system allows. Indeed, quite a deal of economic analysis also makes this assumption. However, once a subdivision or apartment building is approved by the planning system, the private choices of the developer determine how fast the approved new housing is developed. This includes how fast they sell, which is the key limiting factor of the build-to-order model of new housing production. 

To demonstrate the degree to which these private choices limit the potential rate of new housing supply I proposed looking at the Development Rate Ratio (DRR). 


The DRR shows the average speed of development as a ratio of the maximum speed, using the average monthly rate in the fastest three-month window. A lower number indicates that the new housing development proceeded more slowly than was demonstrated to be possible.

Development Rate Variability (DRV)

A second metric is Development Rate Variability (DRV). DRV is the ratio of the fastest speed of monthly sales to the slowest monthly sales during a development. This shows how sensitive to market conditions the choice of sales can be. A higher DRV shows how much the private choices of housing developers change the rate of new housing supply. 


It may be argued that it is impossible to sell fast in a depressed market. But this is only true if prices are held constant. The very heart of the housing supply debate is whether planning changes create conditions for private housing developers to build faster at lower prices.

These two new metrics can help paint a picture of the variation in the market absorption rate due to the private choices of landowners. To complement these metrics, we also create new metrics of the economic returns available in housing development from varying the rate of supply in response to market conditions. 

Delay Premium (DP)

What is the economic gain from varying the rate of supply of new housing to “meet the market”?

To answer this question a sensible counterfactual must be established. The counterfactual implied in most economic analyses of housing is that housing is supplied once the market price gets above the feasible price for development. In other words, housing developers fix the price of all housing (or land lots) at the beginning of the project (a fixed point in time) then vary only the speed of sales to match market demand at that initial feasible price. 

The dynamic approach recognises an economic return to varying both the rate of supply and the price. This is then the difference in revenue between the following two approaches.
  1. Setting a price at the beginning of the project and selling all dwellings or housing lots at that price until the project is completed
  2. Varying both the rate of supply and price to maximise profits from the project. 
A metric that identifies the economic gains to delay is the Delay Premium (DP). The DP is the share of total revenue that was made by varying price as well as quantity (ignoring discounting) and is calculated as follows.


Two parts of this equation need some explanation. First, when applied to detached housing subdivisions the total revenue is for land only, not for homes. This is because the additional gain from building the home comes with added construction costs leaving the land value as the net income. Second, the reason for including the minimum land price rather than the initial price is because the lowest price in the sequence of sales indicates the minimum willingness to sell. 

A higher DP means that a larger share of the total revenue came from actively varying both price and quantity during the selling period. 

Available Delay Premium (ADP)

Another metric that shows the economic gains to delay is the Available Delay Premium (ADP). It measures the maximum difference in sales price over the life of a project (the peak price per sqm that often occurs at the end of a project and the lowest sale price that usually occurs near at the beginning) multiplied by the total sold land area as a proportion of actual revenue. This metric indicates a theoretical maximum degree to which revenue could have varied (as a proportion of actual revenue) if all sales were made at the highest price compared to all sales being made at the lowest price.  


The interpretation of the ADP is to show how important choosing the timing of sales can be to the final returns of a project. A higher ADP indicates that varying sales rates due to changes in demand, and hence price, will have a higher economic payoff.

Applying these metrics

Jordan Springs is a 900-hectare residential subdivision located in Penrith (53km west of Sydney’s CBD) and was approved for development in 2009 with the first residents moving in during 2011. 

By 2012 the development was owned by Lendlease, which published in its annual report that year that the area would ultimately provide over 2,000 detached dwellings and 200 apartment dwellings, with an expected 10-year development timeline. The subdivision masterplan is below. 


Unfortunately, data on land and house sales in this subdivision is only available to me at the moment from 1st October 2015 to 8th October 2021, a period over which there were an estimated 2,131 new land lot or dwelling sales.

Summary of absorption rate metrics

The four absorption rate metrics for the available data on this large subdivision project are summarised in the table below. 


In this data, total revenue was around $1 billion. The 0.13 DP represents about $137 million of value that was gained by varying prices during the project rather than setting the minimum profitable price and selling all lots at that price. The difference in revenue between selling all lots at the lowest per square metre price and the highest price was $310 million. These figures also provide insight into the variability and risk involved in land and housing development. 

Further analysis and detail

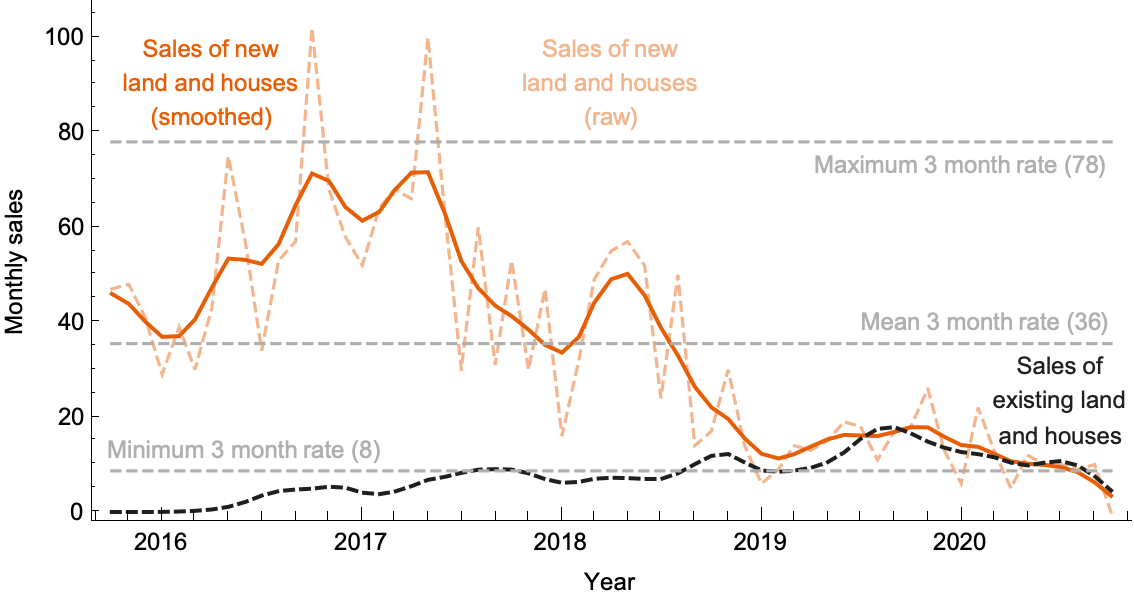
It is also worth looking at the variation in sales and prices over the available data for the Jordan Springs project. 

The chart below shows the smoothed monthly rate of land and house sales for new dwellings (orange), alongside the repeat sales (dashed black) over time. Minimum, maximum and mean sales rates are marked (which are used to generate the DRR and DRV metrics). Notice that in the quiet housing market of 2019 that sales were much slower than in the busy 2016-17 market period. 


The next chart below shows the land price per square metre observed in the sales data over the same time period, with maximum, minimum and mean prices market (which inform the DP and ADP metrics). During this five year window, land prices varied by around 30% (the ADP metric) but had noticeable peaks and troughs that coincided with macroeconomic conditions. 


Finally, we can look at the relationship between price growth and the rate of supply in the final chart below. Although these data points do not generate a statistically significant relationship, visual inspection shows clearly that periods observing price growth also saw faster new supply, especially in earlier development stages during 2016-18, as expected if the developer is optimising sales rates and price to maximise their revenue (as predicted by the logic of the market absorption rate). 


The enormous variation in the rate of supply in large projects such as Jordan Springs, with thousands of approved dwellings, is a clear indication of macroeconomic and market conditions being the main determinant of the rate of new housing supply. 

Wednesday, December 15, 2021

Ignoring age and COVID risk is unscientific

I listened to a frustrating Sam Harris podcast about COVID policy yesterday. What struck me about these "expert" commentators was that they

  1. kept finding reasons to link COVID policy back to Trump, which was weird, and
  2. all but ignored the enormous age variation in COVID risk. 

Both these seem like popular ways of thinking, unfortunately. 

I want to comment briefly on the second issue. This should help explain why I support vaccinations for the elderly but feel strongly against vaccinating children, vaccine targets and mandates. 

The risk of serious illness or death with COVID is far more age-skewed than most viruses. In the below figure I show this skew. COVID is a serious disease for the elderly.


I also plot vaccine risks in the dashed orange. You might not be able to see it because it is so close to the axis. For age 70, the benefit-to-cost ratio of the vaccine is about 250x (i.e. the blue line is 250 times higher than the dashed orange line). A great outcome and something anyone would be foolish not to recommend. 

But exponential curves are deceiving. Let's zoom in on this curve for young age cohorts. I do this below (curve equation is 10^(-3.27 + 0.0524xage)). Notice now that we are way down near the vaccine risk. It's close. I show a broad range of risks and call this COVID curve the risk of serious illness. I do this because reality doesn't follow the neat equation I used to plot the curve and children are likely even lower risk than shown. 


In short, because the age skew of COVID risk is so severe, these huge many-hundred-times benefit-to-cost ratios can reverse at low ages so that the costs are many times the benefits. This is why so many doctors are calling for a halt to mandates for vaccinating children. 

We should let this well-known information about COVID guide us rather than politics and panic.